Read Your React Native App's Console Logs From Your Coding Agent (ExecBro)
clear_logsget_logsget_pressable_elementsios_screenshotscan_metrosearch_logsswipetap
Debugging a React Native screen usually costs you two context switches. First you tap your way through the app by hand to reach the screen that misbehaves. Then you alt-tab to the Metro terminal and scroll a firehose of console output looking for the three lines that matter — and if you want your coding agent to help, you copy-paste those lines into the chat.
ExecBro removes both. It exposes the running app to your agent over MCP: get_pressable_elements tells the agent what's tappable, tap and swipe drive the UI, ios_screenshot shows it what happened, and get_logs / search_logs / clear_logs give it direct access to the console buffer. The agent navigates and reads the logs itself.
This walkthrough covers both halves: navigating to a screen that isn't even visible yet, then producing a clean, trustworthy log capture on it.
1. Connect the MCP session with scan_metro
Before any device tool works, the MCP server has to attach to the running app. If you skip this, the first tool call fails loudly:
Error: No apps connected. Run 'scan_metro' first.
Run scan_metro against the port Metro is serving on:
mcp__execbro__scan_metro {"startPort": 8090, "endPort": 8090}Metro scan results:
Port 8090: Found 1 device(s)
- Connected to org.reactjs.native.example.RnDebuggerTestApp (iPhone 14)
One device, connected. Every tool below now has something to talk to.
2. Establish state with ios_screenshot
Take a screenshot before you act. This is the agent's eyes — it's the difference between a script that blindly fires taps and one that can notice it's on the wrong screen.
mcp__execbro__ios_screenshot {"udid": "A4287B5C-5156-40B1-86F9-32CD855FBD4A"}Screenshot: raw 1170x2532 px → delivered 924x2000 px (downscaled 0.790× to fit API limits).
Pressable coordinates below are in delivered-image pixels.
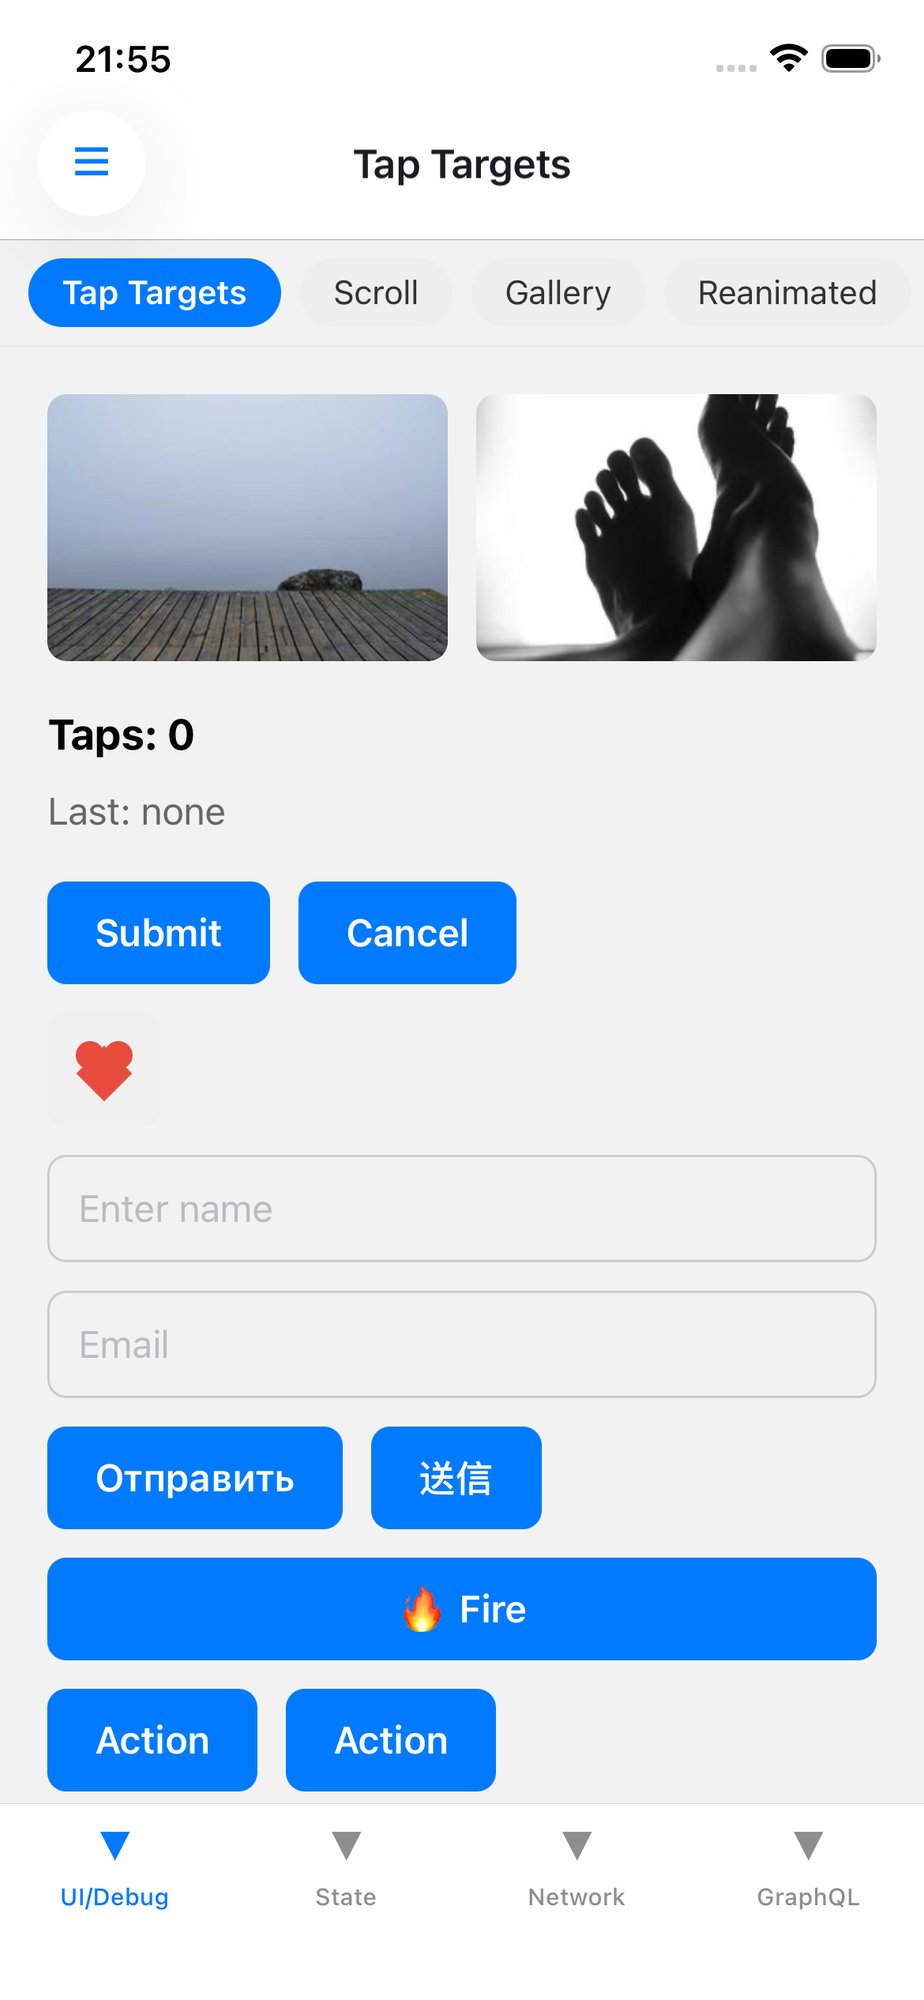
Note the downscale line: coordinates you get back are in delivered-image pixels, not raw device pixels. You don't have to do that math yourself as long as you use the coordinates the tools hand you.
3. Map what's tappable with get_pressable_elements
Never guess at coordinates. get_pressable_elements returns what is actually tappable right now:
mcp__execbro__get_pressable_elements {}Found 20 pressable elements (3 icon-only, 17 with text labels)
1. HeaderMenuButton "☰" — center:(92,164) frame:(47,128 88x71) [a11y="Open navigation …"]
The nav chips in this list stop at "Tap Targets", "Scroll", "Gallery", and "Reanimated". There is no "Diagnostics" chip — the screen you actually want.
This is the single most useful thing to internalize about the tool: an element missing from this list means "not on screen yet", not "not in the app." The list is a live map of the current viewport, not a component inventory.
4. Scroll off-screen content into view with swipe
Off-screen content can't be tapped, so scroll it in. Swipe left across the nav strip, using the y-coordinate the strip actually sits at:
mcp__execbro__swipe {"startX": 800, "startY": 294, "endX": 200, "endY": 294, "durationMs": 400}{
"success": true,
"platform": "ios",
"from": {"x": 800, "y": 294},
"to": {"x": 200, "y": 294}
}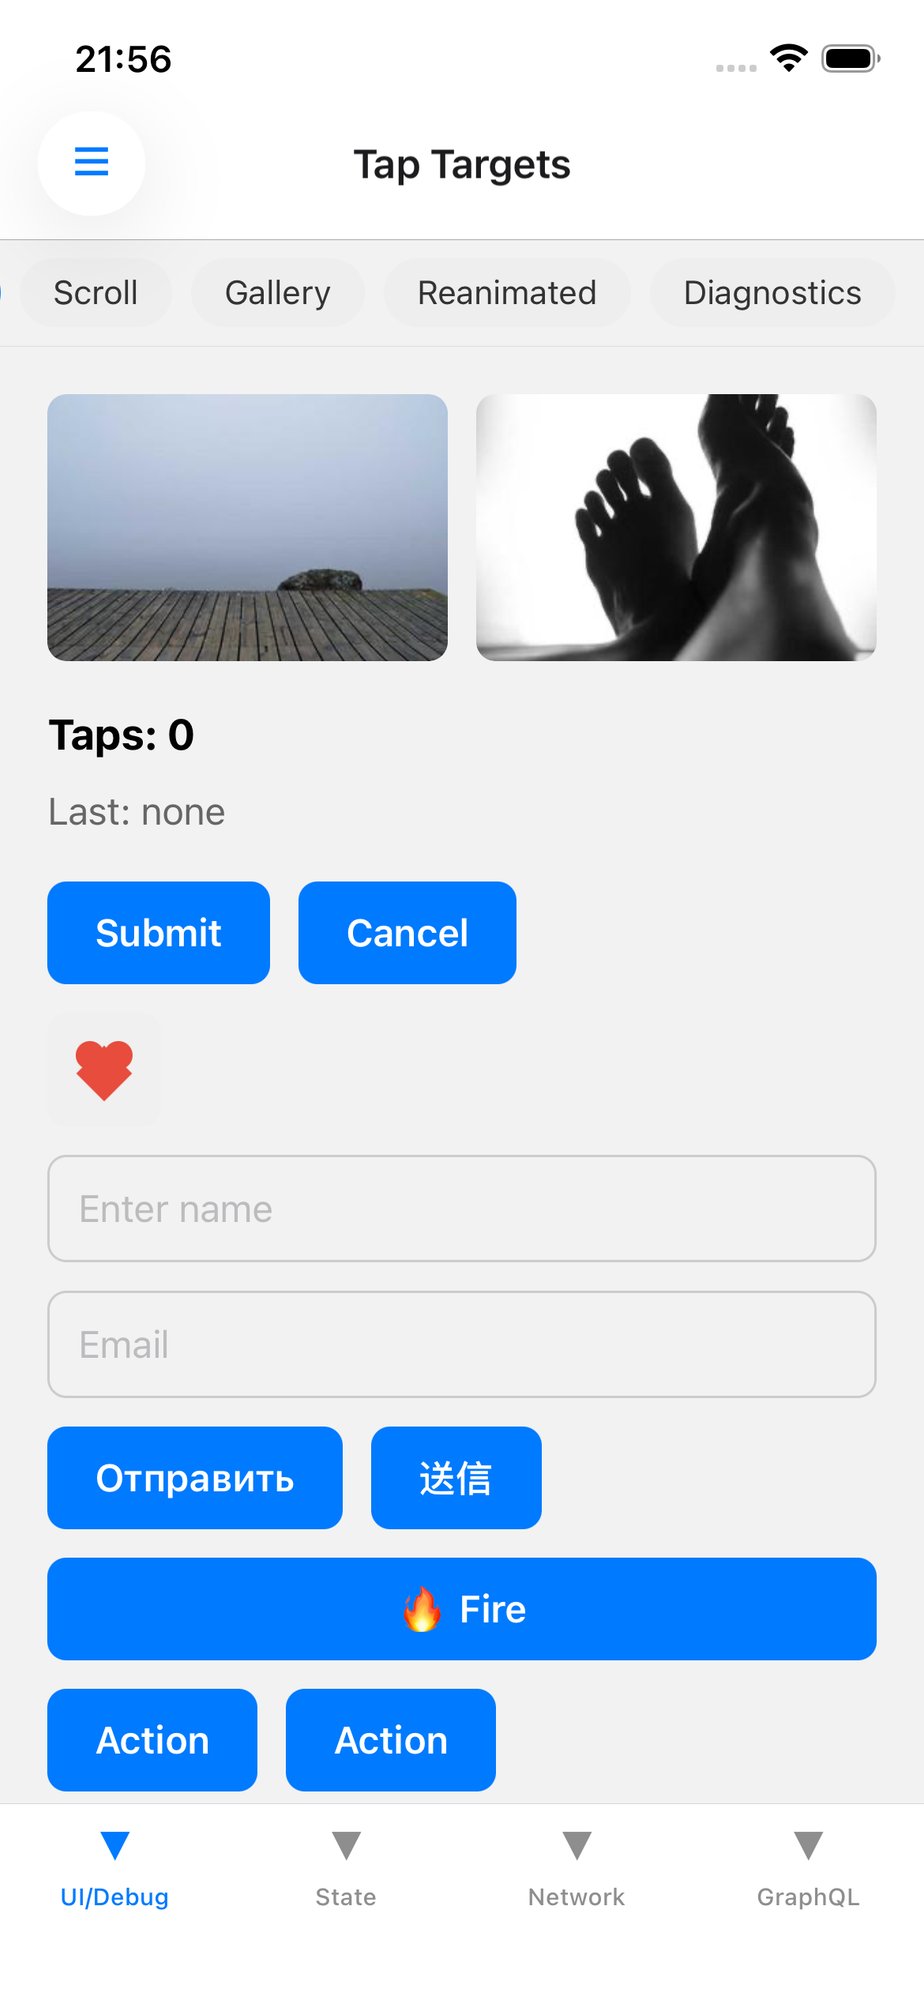
Then re-read the map. Don't assume the swipe worked — verify it:
mcp__execbro__get_pressable_elements {}Found 21 pressable elements (3 icon-only, 18 with text labels)
Twenty-one now instead of twenty, and "Diagnostics" is item 6 at center (773, 294) with testID screen-nav-Diagnostics.
Look → act → look again. That's the whole loop.
5. Tap by testID instead of coordinates
Now that the element is genuinely on screen, tap it by testID. Coordinates are fragile across screen sizes and scroll positions; a testID is not:
mcp__execbro__tap {"testID": "screen-nav-Diagnostics", "screenshot": false}{
"success": true,
"method": "accessibility",
"query": {"testID": "screen-nav-Diagnostics"},
"pressed": "Diagnostics"
}Confirm you landed where you intended with another screenshot:
mcp__execbro__ios_screenshot {"udid": "A4287B5C-5156-40B1-86F9-32CD855FBD4A"}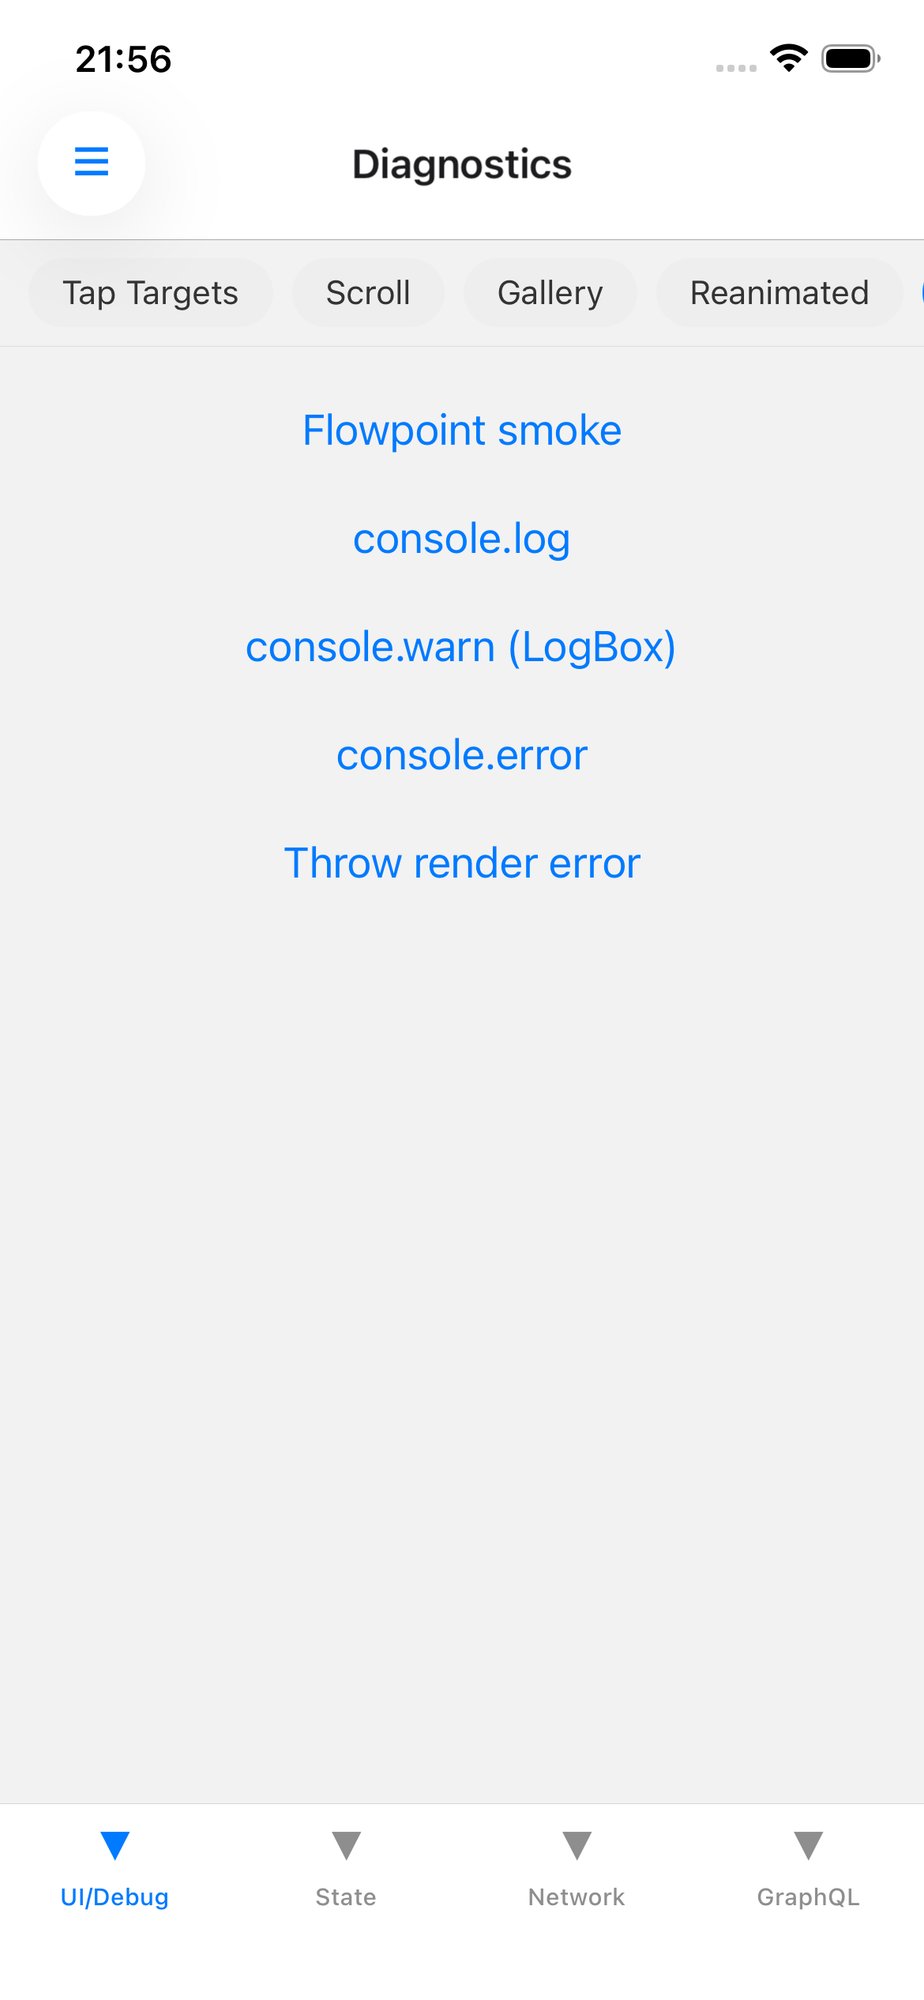
The Diagnostics screen is up, with its console.log, console.warn (LogBox), and console.error buttons.
6. Read the buffer with get_logs(summary: true)
The console buffer lives in the MCP server, not in your terminal — which is why the agent can read it directly instead of asking you to paste. Always start with the summary rather than a dump:
mcp__execbro__get_logs {"summary": true}Log Summary (SDK):
Total logs: 4
By Level:
log: 4
Counts by level and the last few messages, without flooding the agent's context with hundreds of lines. Narrow after you've seen the shape.
Why there are already four entries: the execbro-sdk difference
Look at the label: Log Summary (SDK). Those four entries were emitted at app startup — long before the MCP session connected. That is only possible because this demo app has execbro-sdk installed.
The distinction matters:
- Without the SDK, the MCP server can only show output emitted after the app connected. Anything logged during startup is gone by the time you attach.
- With the SDK, it patches
consolethe moment the app boots and keeps its own circular buffer inside the app process.
That in-app buffer also survives the connection. If Metro restarts, or your agent disconnects and reconnects, the history is still sitting in the app waiting to be queried. Without the SDK, a dropped connection means everything logged while you were away is simply unrecoverable.
The (SDK) suffix in the response is how you tell which mode you're in.
7. Reset with clear_logs before reproducing
Whatever mode you're in, the buffer is circular — roughly 500 entries. A chatty app pushes its oldest lines out from under you, so scrolling back and hoping the evidence survived is a bad bet. Clear first, then reproduce:
mcp__execbro__clear_logs {}Cleared 4 log entries from all devices.
Verify the baseline is genuinely clean:
mcp__execbro__get_logs {"summary": true}Log Summary (SDK):
Total logs: 0
Zero. Everything from here belongs to the run you're about to do — that's what makes the result trustworthy.
8. Reproduce, then narrow with level and search_logs
Fire the reproduction. Here that's three taps, one per console level:
mcp__execbro__tap {"testID": "diag-log",   "screenshot": false}
mcp__execbro__tap {"testID": "diag-warn",  "screenshot": false}
mcp__execbro__tap {"testID": "diag-error", "screenshot": false}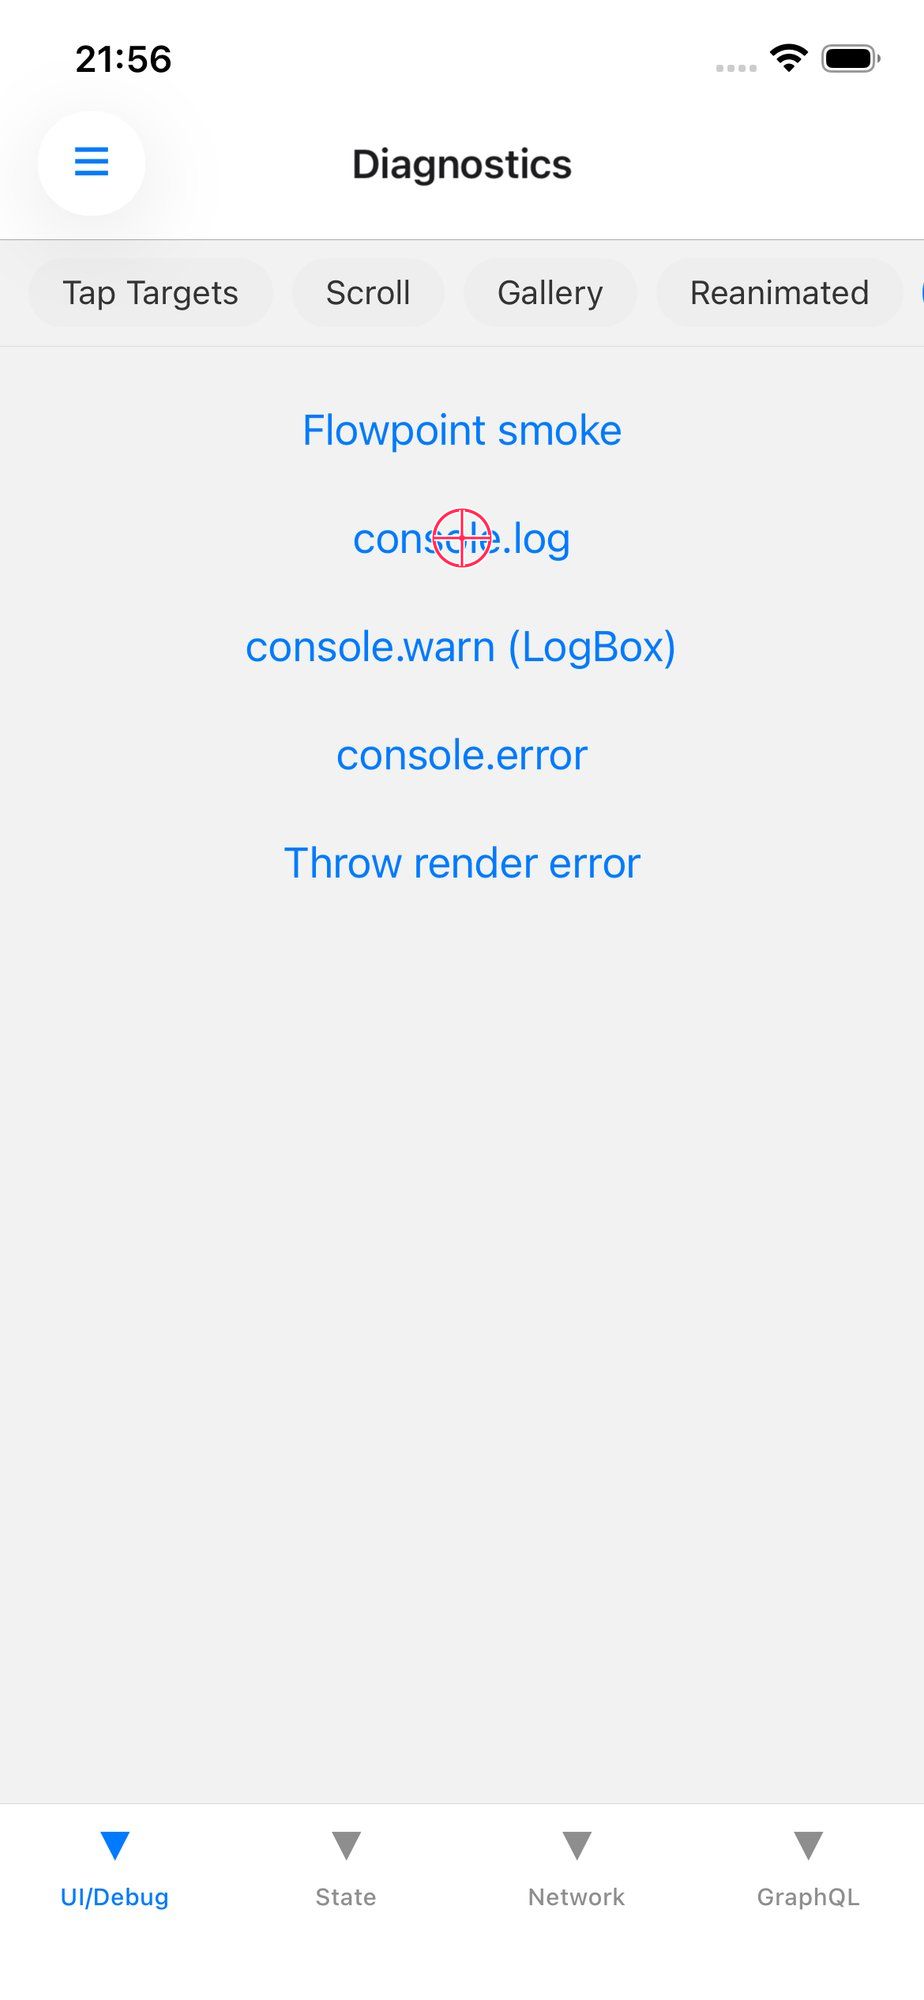
Expect no visual change — these buttons only write to the console. That's precisely the case where log tooling earns its keep: a screenshot tells you nothing.
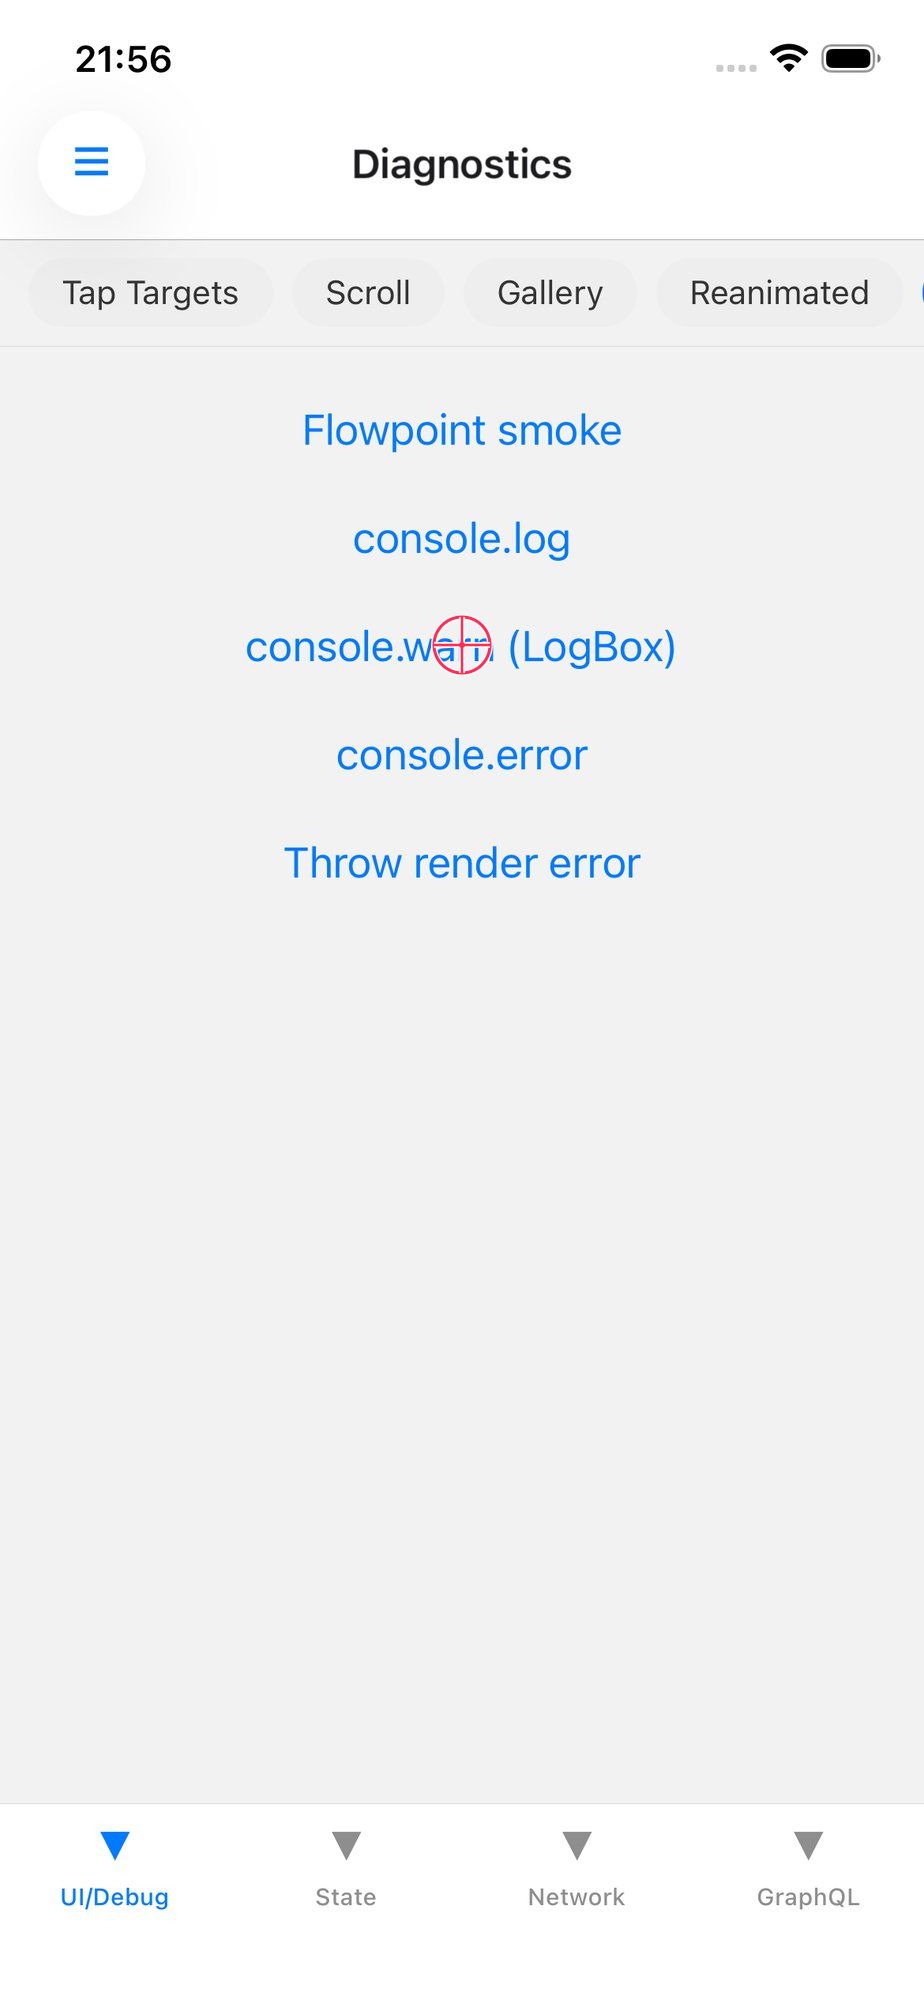
Summary first, again:
mcp__execbro__get_logs {"summary": true}Log Summary (SDK):
Total logs: 3
By Level:
log: 1
warn: 1
error: 1
Three entries, one per level — and all three belong to your reproduction. Now narrow. Filter by severity with level:
mcp__execbro__get_logs {"level": "error"}Console Logs (1 entries, SDK):
9:56:52 PM [error] [playground] error log
Or filter by text across all levels with search_logs:
mcp__execbro__search_logs {"text": "playground"}Search results for "playground" (3 matches, SDK):
9:56:52 PM [error] [playground] error log
9:56:47 PM [warn] [playground] warning for LogBox
9:56:41 PM [log] [playground] log message
The rule of thumb: reach for search_logs when you already know the string you're hunting for, and get_logs when you're still exploring and want to slice by severity.
9. Leave a clean buffer behind
Clear once more when you're done so the next investigation starts from zero rather than inheriting your noise:
mcp__execbro__clear_logs {}Cleared 6 log entries from all devices.
Conclusion
You can now drive a running React Native app entirely from your coding agent: screenshot to establish state, get_pressable_elements to see what's real, swipe to bring off-screen content into reach, and tap by testID to act — then get_logs, level, and search_logs to read the console the agent already holds, with clear_logs bracketing the reproduction so the evidence you collect is unambiguous.
No manual tapping. No scrolling the Metro terminal. Look, act, look again — then read the logs.