React Native MCP Servers in 2026: DevTools, Debuggers, and What Your Agent Actually Needs
clear_logsget_logsget_pressable_elementsios_screenshotscan_metrosearch_logsswipetap
A React Native MCP server is a bridge between your coding agent and your running app. MCP (the Model Context Protocol) is the standard that lets tools like Claude Code, Cursor and Windsurf call external tools; a React Native MCP server exposes the things you normally do by hand while debugging (read the console, watch network requests, tap through screens, take screenshots) as tools the agent can call itself.
Without one, your agent debugs blind. It edits code, then asks you to run the app, tap through the reproduction, and paste back whatever the Metro terminal printed. With one, the agent does that loop on its own: act on the device, observe the result, read the evidence, fix, verify.
If you searched "react native devtools mcp" or "react native mcp", you probably found half a dozen GitHub repos with similar names and no clear picture of how they differ. This guide covers what a complete debugging loop actually requires, what the open-source servers worth knowing about do and where each stops, and a real, unedited demo of the full loop using ExecBro.
What a full debugging loop requires
Before comparing tools, it is worth being precise about what "debugging from an agent" means. A fix-and-verify cycle on a real device needs six capabilities:
- See the screen. Screenshots, and ideally a structured view of what is rendered, so the agent knows where it is.
- Act on the device. Tap, swipe, type. Reading logs is useless if a human still has to drive the reproduction by hand.
- Read the console. Logs with filtering and search, not a raw dump that floods the agent's context window.
- Inspect the network. Which requests fired, with what payloads and responses; and for error-path testing, the ability to mock responses or simulate offline.
- Inspect state and components. The component tree, props, and app state (Redux or otherwise), so the agent can check what the UI believes, not just what it shows.
- Work on both platforms without app changes. iOS and Android, attaching to the app you already have running, with no native modules to install first.
A server that covers only one or two of these still helps, but the loop breaks wherever a capability is missing: the agent reads the error, then hands control back to you to reproduce it.
The open-source React Native MCP servers
These are the projects that currently occupy the "react native mcp" search results. All of them are real and useful; the differences are in how much of the loop each one covers.
metro-mcp
steve228uk/metro-mcp (metromcp.dev) is the most complete of the community servers. It is plugin-based, discovers Metro by port scanning, and attaches to Hermes over the Chrome DevTools Protocol, which gets it a long way with no app code changes: console and error collection, network monitoring with response bodies, Redux state viewing and dispatch, React fiber tree inspection, accessibility audits, AsyncStorage reads, CPU and heap profiling, UI automation (tap, swipe, type), and recording interactions into Appium, Maestro or Detox tests. It works with Expo and bare React Native, including physical devices over USB, and an optional __METRO_BRIDGE__ hook adds custom commands and state exposure.
Where it stops: the documented surface has no screenshots as of this writing, so the agent acts without visually verifying where it landed, and there is no network mocking or condition simulation for error-path testing.
react-native-debugger-mcp
twodoorsdev/react-native-debugger-mcp connects to your app's debugger via Metro and retrieves console logs in real time. Setup is a single npx entry in your MCP config.
Where it stops: it is a log reader (no screenshots, no interaction, no network), and the repository has since been archived on GitHub, so it is no longer maintained. It still works as a minimal "let the agent see the console" option, but do not expect fixes or updates.
Limelight
getlimelight/limelight-sdk (getlimelight.io) takes the SDK route: you install @getlimelight/sdk in the app and get state inspection for Zustand and Redux, network monitoring with GraphQL-first support, console streaming with stack traces, render tracking, and full-stack tracing via server-side middleware, with an MCP integration on top for agents.
Where it stops: it is observation through an in-app SDK, so no screenshots or interaction, and everything depends on shipping their code inside your app. The repository has also had no commits since March 2026 as of this writing, and in this category that is effectively abandonment, not a pause. A debugging tool sits on top of a moving stack: new React Native releases, Hermes and Bridgeless changes, OS and simulator updates, and the long tail of device quirks. Tools in this space stay correct through constant upkeep (ExecBro ships fixes near-daily for exactly this reason), so a five-month-frozen inspector may not just lack features, it may show you output that is quietly wrong. When we tried Limelight firsthand, the desktop app already had visible bugs; nothing has shipped since.
Reactotron MCP
Reactotron, Infinite Red's long-standing RN inspector, now exposes an MCP server so agents can read its timeline: events, state, network activity, and custom commands sent to the app.
Where it stops: it inherits Reactotron's model, which means installing and configuring reactotron-react-native inside your app first. It observes what the Reactotron client reports; screen interaction and screenshots are out of scope.
Capability comparison
| Capability | ExecBro | metro-mcp | react-native-debugger-mcp | Limelight | Reactotron MCP |
|---|---|---|---|---|---|
| Console logs (filter/search) | ✅ | ✅ | ✅ | ✅ | ✅ |
| Screenshots | ✅ iOS + Android | ❌ | ❌ | ❌ | ❌ |
| Tap / swipe / type | ✅ incl. by testID |
✅ | ❌ | ❌ | ❌ |
| Query tappable elements | ✅ | ❌ | ❌ | ❌ | ❌ |
| Network inspection | ✅ | ✅ | ❌ | ✅ | ✅ |
| Network mocking / offline simulation | ✅ | ❌ | ❌ | ❌ | ❌ |
| Component tree / inspection | ✅ | ✅ | ❌ | partial | partial |
| App state (Redux etc.) | ✅ | ✅ | ❌ | ✅ | ✅ |
| Execute JS in the app | ✅ | via __METRO_BRIDGE__ |
❌ | ❌ | custom commands |
| Works without app code changes | ✅ (SDK optional) | ✅ (bridge optional) | ✅ | ❌ requires SDK | ❌ requires client |
| Device management (boot simulator, launch app) | ✅ | ✅ | ❌ | ❌ | ❌ |
| Multiple devices in one session | ✅ per-tool device targeting |
❌ one app per session | ❌ | ❌ | ✅ select connected app |
Table compiled from each project's public documentation in August 2026; open an issue if something has changed.
The pattern: most servers pick one half of the loop. The observers (logs, network, state) leave the agent unable to reproduce anything, and even the broadest of them drives a screen it cannot see: without screenshots and a queryable map of what is tappable, every action is a blind action. ExecBro was built as the whole loop in one server, which is easiest to show rather than argue, so here is the real thing.
The loop in practice, with ExecBro
Everything below is unedited output from an iOS simulator session (the video above is the same session). The task: navigate to a screen that is not even visible yet, then produce a clean, trustworthy log capture on it. No hands on the device at any point.
Connect. One call attaches the server to whatever is running:
mcp__execbro__scan_metro {"startPort": 8090, "endPort": 8090}Metro scan results:
Port 8090: Found 1 device(s)
- Connected to org.reactjs.native.example.RnDebuggerTestApp (iPhone 14)
Look. A screenshot establishes where the app actually is:
mcp__execbro__ios_screenshot {"udid": "A4287B5C-5156-40B1-86F9-32CD855FBD4A"}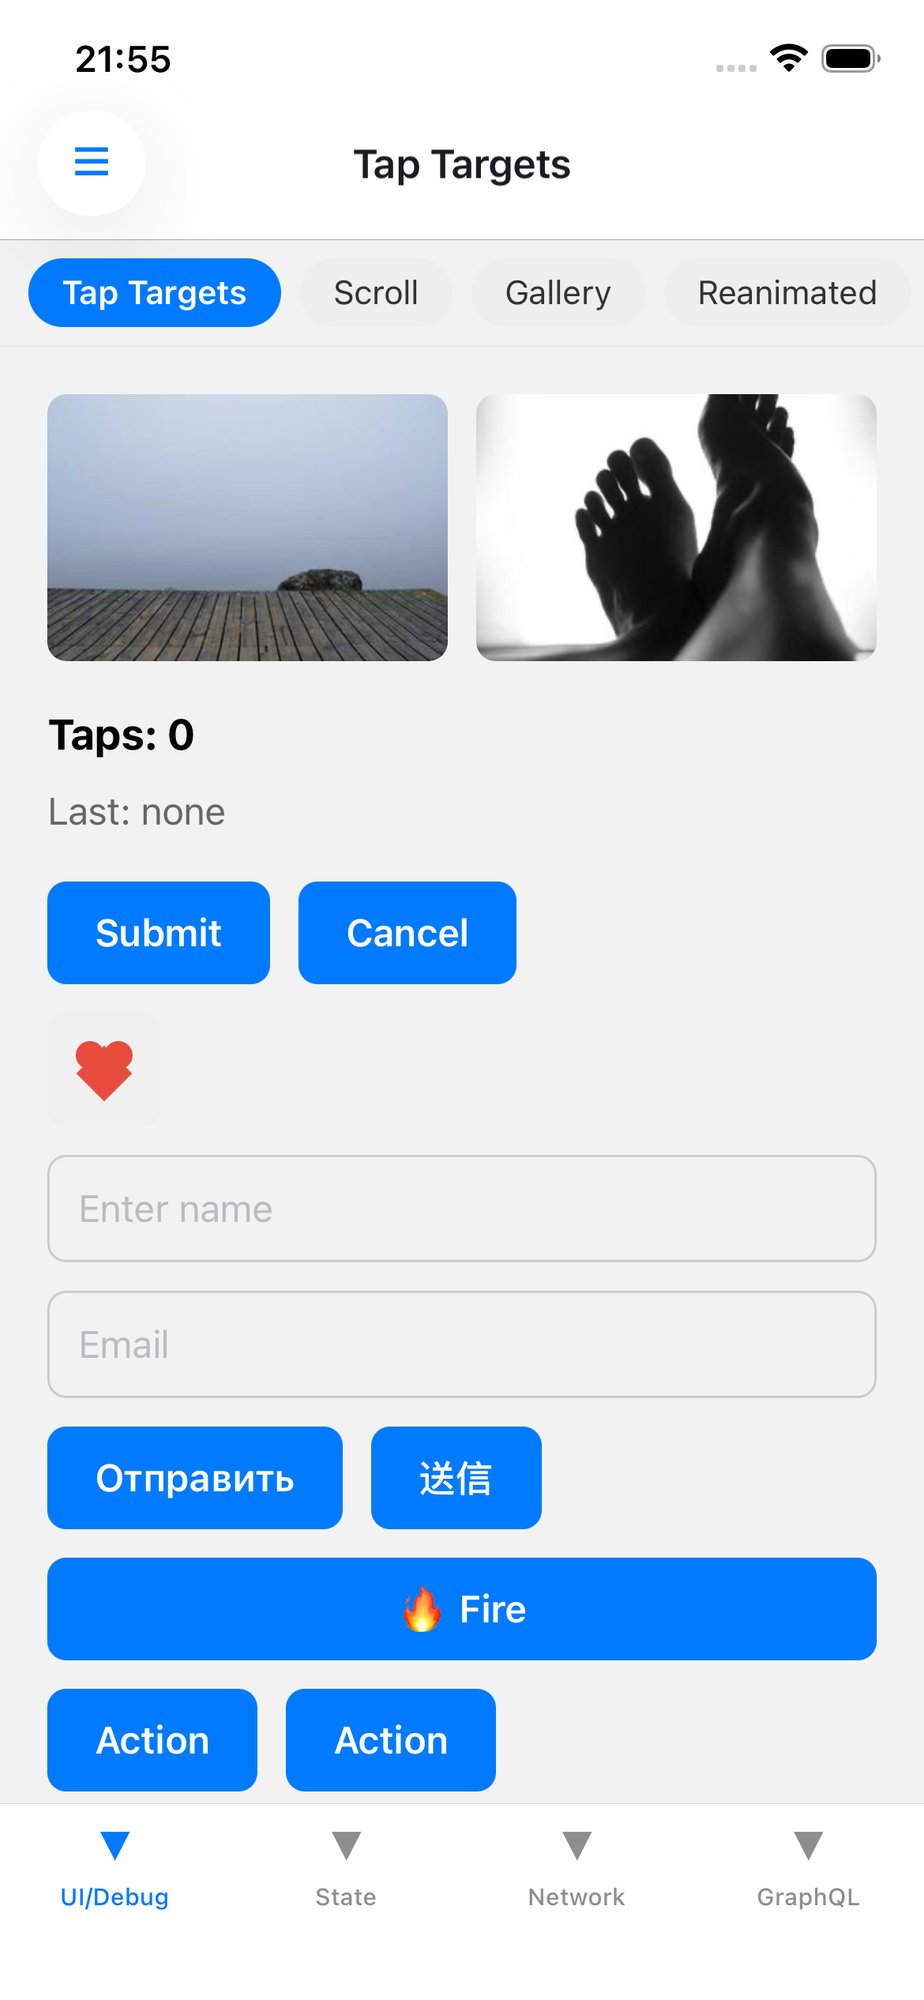
Map the screen instead of guessing coordinates. This is where a React-aware server differs from blind coordinate automation:
mcp__execbro__get_pressable_elements {}Found 20 pressable elements (3 icon-only, 17 with text labels)
1. HeaderMenuButton "☰" — center:(92,164) frame:(47,128 88x71) [a11y="Open navigation …"]
The screen we want, Diagnostics, is not in the list, which means it is not on screen yet. So the agent swipes the nav strip and re-reads the map, and now taps the target by testID rather than by pixel position:
mcp__execbro__tap {"testID": "screen-nav-Diagnostics", "screenshot": false}{
"success": true,
"method": "accessibility",
"query": {"testID": "screen-nav-Diagnostics"},
"pressed": "Diagnostics"
}Read the evidence. Clear the buffer, fire the reproduction (three taps that emit a log, a warn and an error), then read back exactly what happened:
mcp__execbro__get_logs {"summary": true}Log Summary (SDK):
Total logs: 3
By Level:
log: 1
warn: 1
error: 1
mcp__execbro__get_logs {"level": "error"}Console Logs (1 entries, SDK):
9:56:52 PM [error] [playground] error log
Look, act, look again, read. The agent did the whole cycle without a human touching the simulator or the Metro terminal. The console logs tutorial walks through this session step by step, and the network mocking tutorial shows the part no other server on this page attempts: forcing a 500, a malformed payload, or airplane mode so your real error handling actually runs.
Beyond the loop above, ExecBro also covers the rest of the surface in the comparison table: component tree inspection, Redux state reads and dispatches, executing JS inside the app, bundle error checks, OCR on screenshots, and booting simulators or launching apps so an agent can start from a cold machine.
It is also not limited to one device. scan_metro connects every simulator and emulator running against the target Metro instance at once, logs and network requests are buffered per device, and every tool accepts a device parameter, so a single agent session can drive an iPhone simulator and an Android emulator side by side and dispatch each action to the right one. That is how you check a fix on both platforms in one conversation instead of two.
FAQ
Is there an official React Native devtools MCP server?
No. The React Native core team ships React Native DevTools (the Chrome DevTools-based debugger introduced in 0.76), but it is a human-facing GUI, not an MCP server. Everything in the MCP space, including ExecBro, is independent tooling that attaches to the same underlying surfaces (Metro, Hermes, the device).
Do I need to change my app code?
For most servers on this page, including ExecBro, no: they attach to the running app through Metro and the platform toolchain. ExecBro's optional SDK adds capture the wire cannot see, like console output logged before the agent connected, but nothing requires it. Reactotron's MCP and Limelight are the exceptions, since each needs its client SDK configured in the app.
Does this work with Claude Code, Cursor and Windsurf?
Yes. MCP is the point: any MCP-capable agent can use any of these servers. ExecBro is one npx entry in your agent's MCP config; the setup guide covers Claude Code, Claude Desktop, Cursor, Windsurf, Zed and the rest.
Simulator only, or real devices?
ExecBro works with iOS simulators, Android emulators, and physical Android devices via adb. Screenshot and interaction mechanics vary by platform, but the tool surface is the same either way.
What does it cost?
The community servers above are open source. ExecBro is free too, with every tool available on the free tier up to a monthly usage cap; Pro removes the cap for unlimited tool calls.
Choosing
If you want broad CDP-based observation, state access and profiling, metro-mcp is a well-built project with real momentum. If your team already runs Reactotron, its MCP server is the natural add. The log-only servers get you started fastest, but the most established of them, react-native-debugger-mcp, is already archived, which is worth weighing before building a workflow on one.
If you want the loop, where the agent sees the screen, drives it by testID, reads logs and network, forces the error paths, and verifies its own fix, that is the gap ExecBro exists to fill. The two tutorials linked above are real recorded sessions, so you can judge the loop on evidence rather than a feature list.